

According to the latest figures, 12 areas out of 22 have seen a rise, with nine seeing a decrease and one staying the same.
Some places have seen large jumps in their rolling rate of the infection, while others have seen large decreases.
All data is available from: https://coronavirus.data.gov.uk/details/interactive-map.
All data is available from: https://coronavirus.data.gov.uk/details/interactive-map.
5. Coronavirus cases and rates in Peterborough
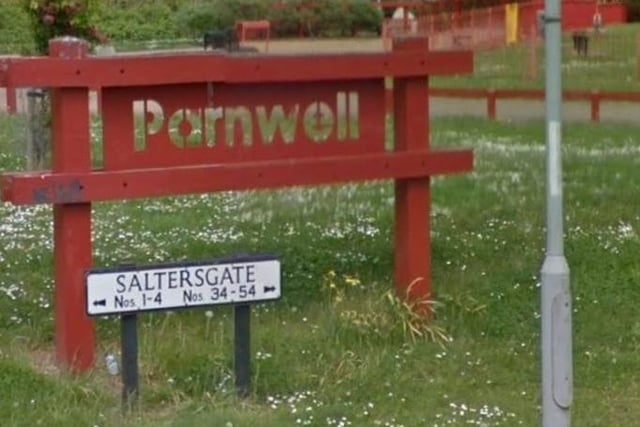
Fengate and Parnwell: 55 cases (+11 compared to the previous week) Rate: 454.9 Photo: Midlands
6. Coronavirus cases and rates in Peterborough
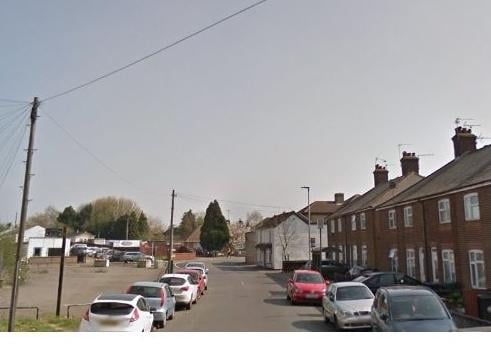
Stanground: 60 cases (+19 compared to the previous week) Rate: 514 Photo: Midlands
7. Coronavirus cases and rates in Peterborough
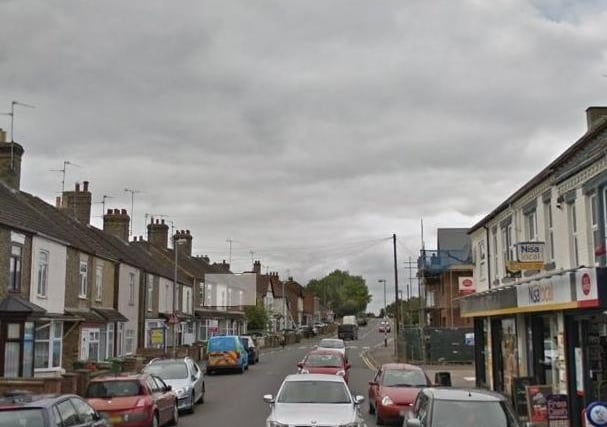
Fletton: 36 cases (+11 compared to the previous week) Rate: 365.9 Photo: Midlands
8. Coronavirus cases and rates in Peterborough
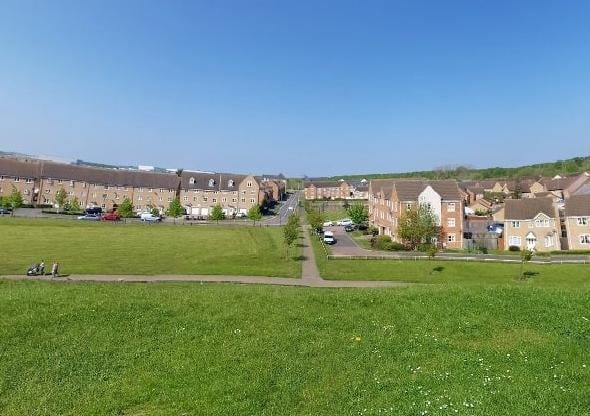
Hargate and Orton Longueville: 49 cases (+12 compared to the previous week) Rate: 503.9 Photo: Midlands