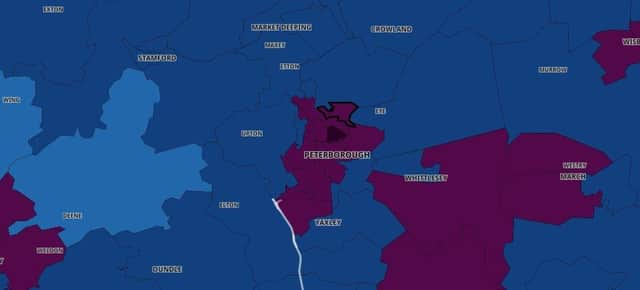
The city as a whole is still seeing the number of cases rise, while other areas are starting to see a reduction in positive tests.
The latest government data shows there were 1,072 cases in the seven days up to January 14 - up by 18 (1.7%) from the previous seven days.
The rate is currently 530 cases per 100,000 people.
A total of 12 of the 22 Peterborough neighbourhoods saw a rise in the number of positive tests over the seven days. Nine saw a decrease, with Orton West & Castor recording the same number of cases.
The biggest rise was seen in Dogsthorpe, which had 17 more cases than the previous week.
Central Park had the highest number of cases - and the highest case rate - with 100 positive tests and a rate of 891.1.
The biggest fall was in Paston, which saw 15 fewer cases.
The data, which is updated every day, is available at https://coronavirus.data.gov.uk/details/interactive-map
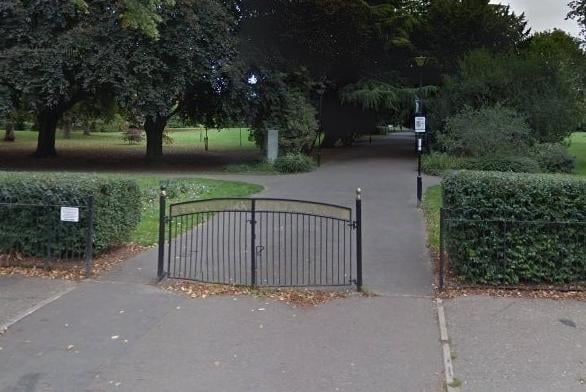
1. Number of cases and rate for Peterborough neighbourhoods
Central Park. 100 positive tests (+10 compared to the previous week) Rate: 891.1 Photo: Midlands
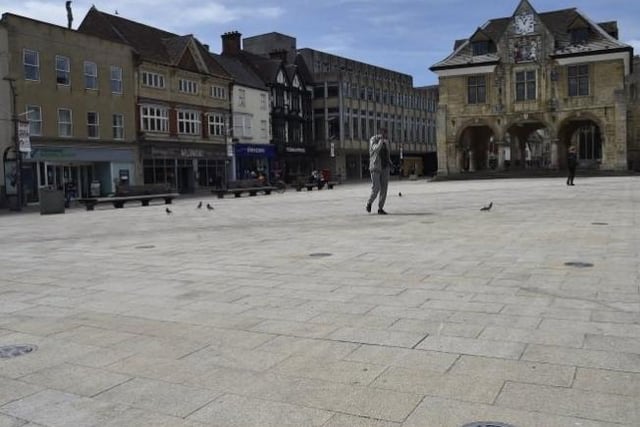
2. Number of cases and rate for Peterborough neighbourhoods
Peterborough Central: 90 positive tests (+10 compared to the previous week). Rate: 721.7 Photo: Midlands
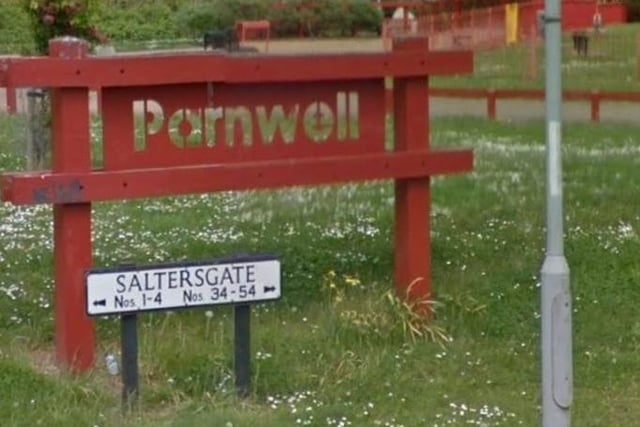
3. Number of cases and rate for Peterborough neighbourhoods
Fengate and Parnwell: 81 positive tests (+1 compared to the previous week) Rate: 670.0 Photo: Midlands
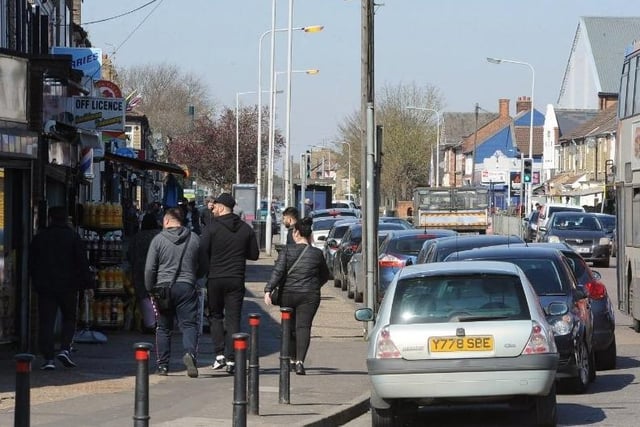
4. Number of cases and rate for Peterborough neighbourhoods
Millfield and Bourges Boulevard: 72 positive tests (+13 compared to the previous week) Rate: 716.4 Photo: Midlands
