
The information, which comes from the Ministry of Housing Communities and Local Government (MHCLG), shows which council wards have the highest concentration of the four pollutants: Benzene; Nitrogen dioxide; PM2.5 particulates; and Sulphur Dioxide.
The higher the number, the worse the pollution is in that neighbourhood.
The average for England is 2.58, and the score for Peterborough as a whole is 2.62.
1. Worst air quality in Peterborough
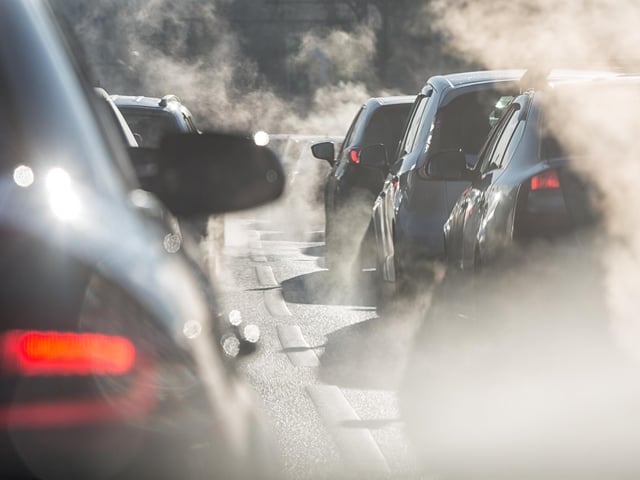
The areas with the worst air quality in Peterborough have been revealed Photo: elcovalana - stock.adobe.com
1 / 6