


Latest data shows that violent crime in Peterborough increased by six per cent last year – with more than nine and a half thousand violent offences recorded in the city in 2025.
The ONS data showed that overall, crime in the city rose by about four per cent.
Now data has revealed where the city neighbourhoods are with the highest rate of violent and sexual offences are.
The statistics are shown as the number of offences per 1,000 people, and are for the 12 months from March 2025 to February 2026.
Ravensthorpe’s figures may be skewed by the location of HMP Peterborough within its boundaries.
The data is available at https://peterborough.localinsight.org/
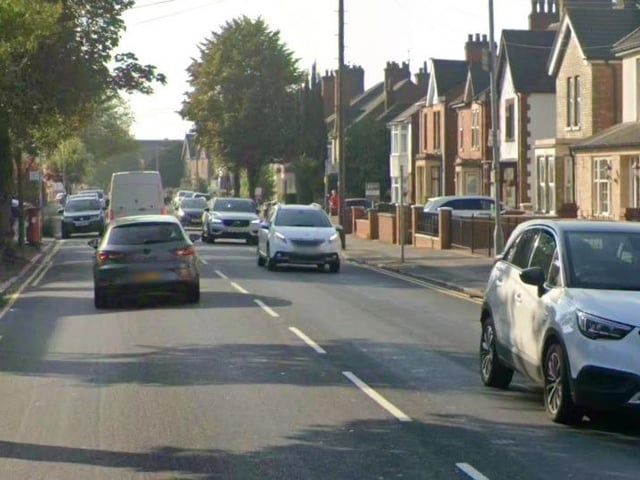
9. Fletton and Stanground
Fletton and Stanground had a rate of 46.5 violent or sexual offences per 1,000 people Photo: Google
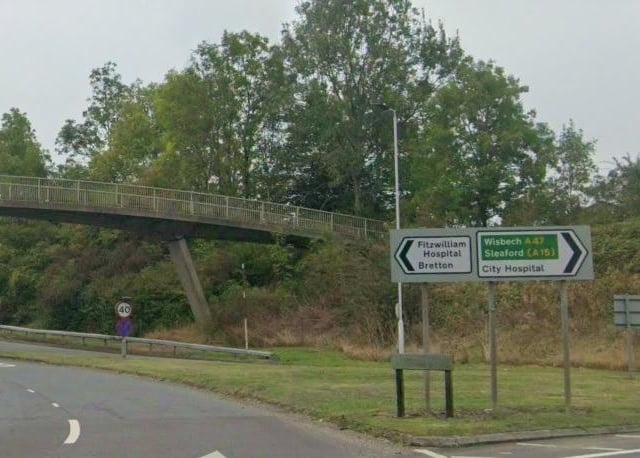
10. Bretton
Bretton had a rate of 45.1 violent or sexual offences per 1,000 people Photo: Google
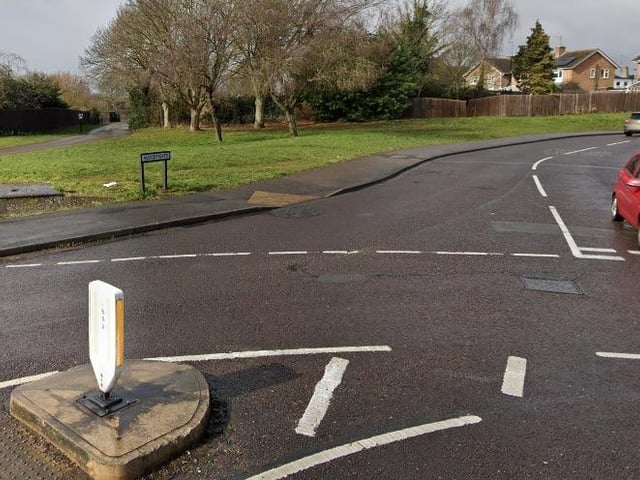
11. West Ward
West Ward had a rate of 44.8 violent or sexual offences per 1,000 people Photo: Google
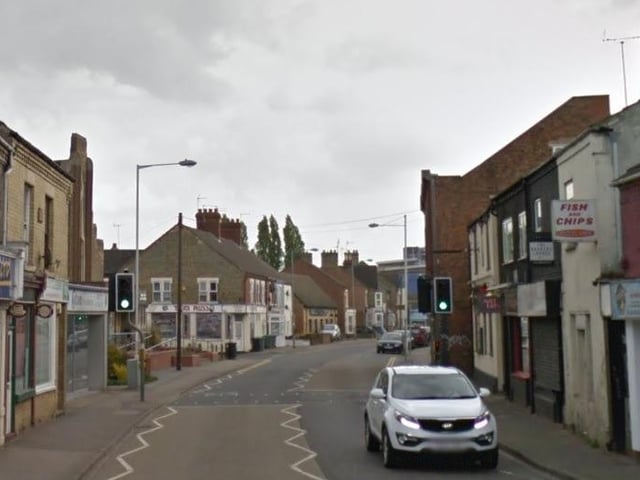
12. Fletton and Woodston
Fletton and Woodston had a rate of 42.4 violent or sexual offences per 1,000 people Photo: Google