
The statistics, which were released earlier this year, show that overall, crime in the city went up by one per cent compared to the previous year.
However, the data, from the Office for National Statistics, also showed that a recorded rise in the number of reported murders (33% increase), sexual offences (8% increase), cases involving death or serious injury caused by illegal driving (60% increase) and violence with injury (4% increase).
The Peterborough Telegraph has been crunching the numbers, and can reveal the city neighbourhoods where the highest number of violent and sexual crimes were recorded. The list is in reverse order – with the neighbourhoods with the lowest rate listed first.
The figures show how many violent or sexual crimes were recorded per 1,000 people.
For context, the Peterborough rate was 46.6, while the rate for England as a whole was 31.7.
The data covers the period from December 2024 to November 2025.

1. Violent crime
There was an increase in violent crime in Peterborough over the past 12 months Photo: HighwayStarz
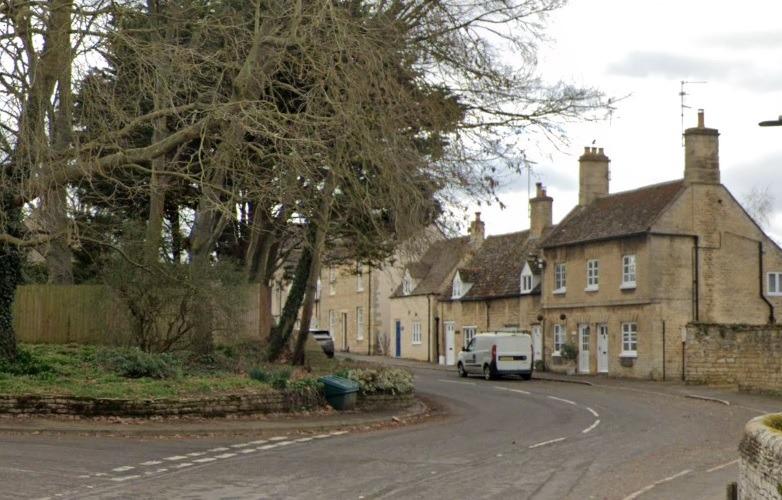
2. Barnack
Barnack had a rate of 15.3 violent or sexual crimes per 1,000 people Photo: Google
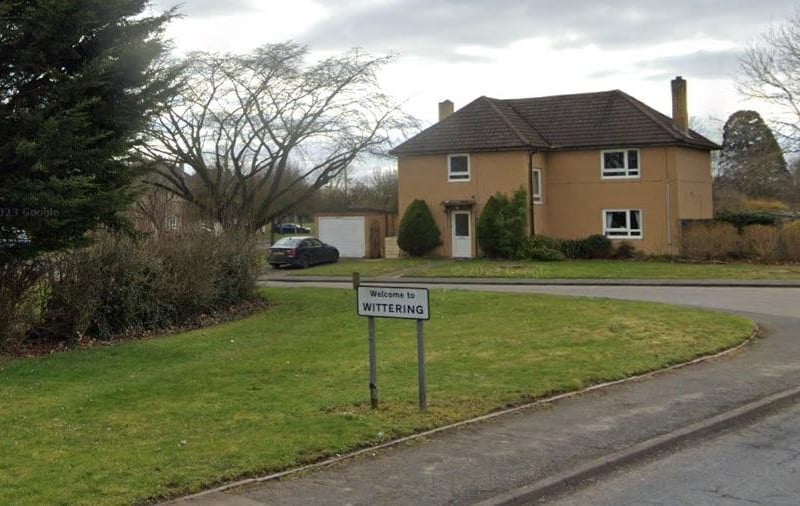
3. Wittering
Wittering had a rate of 17.0 violent or sexual crimes per 1,000 people Photo: Google
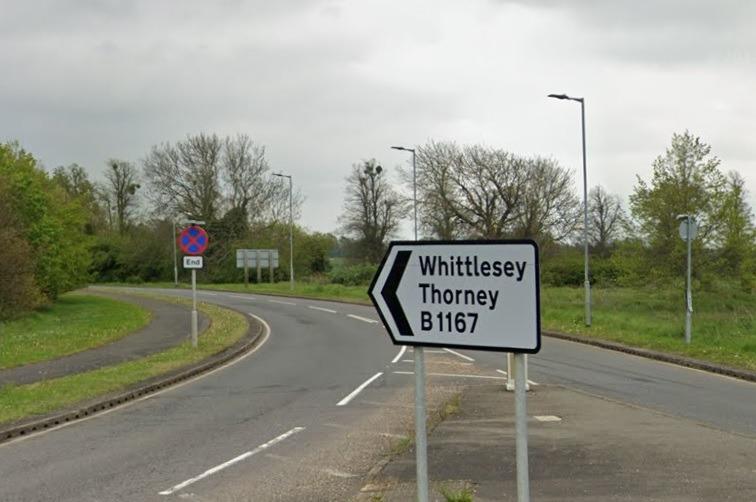
4. Eye, Thorney and Newborough
Eye, Thorney and Newborough had a rate of 25.5 violent or sexual crimes per 1,000 people Photo: Google