
One of the most distressing crimes to fall victim to is burglary – the feeling that your home is no longer as secure as it was previously can hit residents very hard – and that is before you consider the impact of losing possessions, which may have high financial or sentimental value.
Figures for which areas of Peterborough have the highest – and lowest – rates for burglary have been released on a new interactive map.
The Peterborough Telegraph has crunched the numbers – and this is the ranking, from lowest to highest, of how many burglaries were committed, per 1,000 residents, in each area of the city.
The data is available at https://peterborough.localinsight.org/ and related to December 2023 – November 2024.
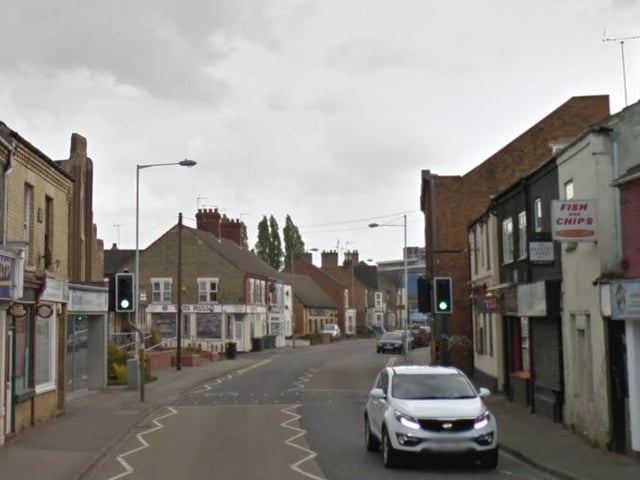
17. Fletton and Woodston
There were 8.6 burglaries per 1,000 people in the Fletton and Woodston ward Photo: Google
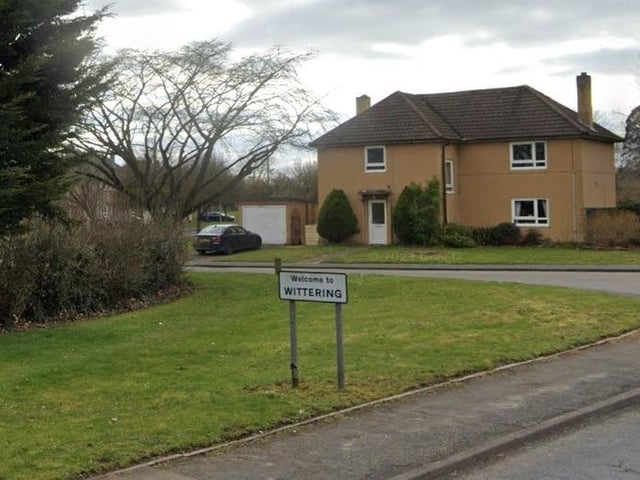
18. Wittering
There were 9.4 burglaries per 1,000 people in the Wittering ward Photo: Google
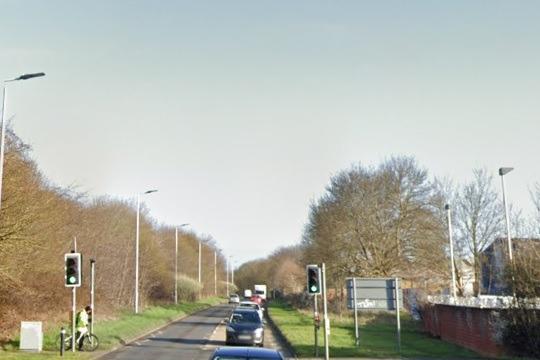
19. Ravensthorpe
There were 9.5 burglaries per 1,000 people in the Ravensthorpe ward Photo: Google