But it can make a huge difference to many people – especially those with respiratory issues such as asthma.
Data revealing the areas of Peterborough with the worst air quality – including how much nitrogen dioxide, particulate matter and sulphur dioxide is in the air – has now been revealed by the Consumer Data Research Centre (CDRC).
Each council ward has been given a rating – with a higher number indicating lower air quality.
The average rating for Peterborough is 0.19, and for England it is 0.26.
The data is available at https://peterborough.localinsight.org/
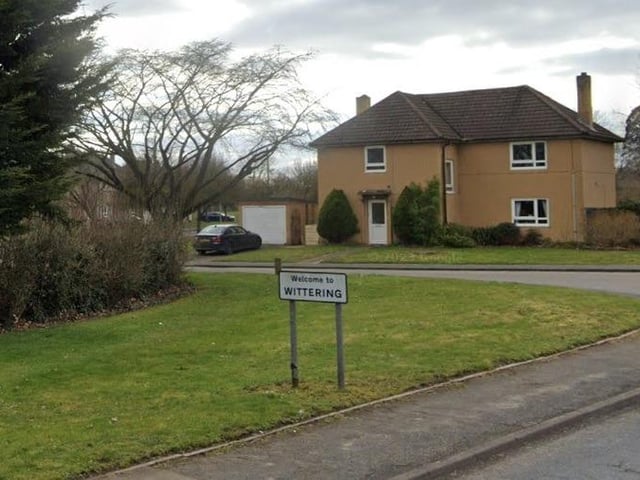
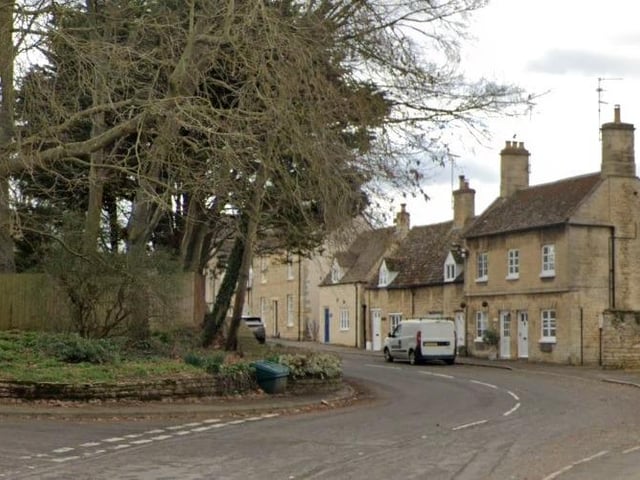
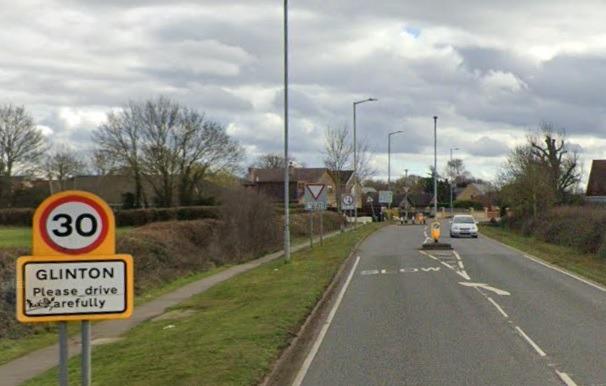
Here are all the the wards ranked according to air quality – with the least polluted wards listed first.
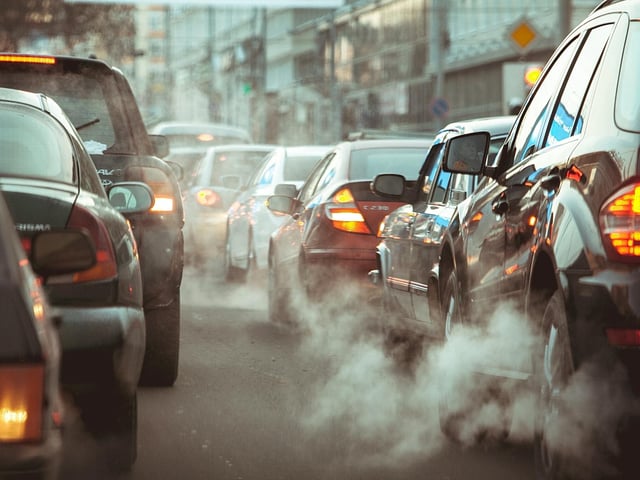
1. Peterborough air quality
The council wards have been ranked according to the pollutants found in the air Photo: Семен Саливанчук