REVEALED: Peterborough house prices rising at more than double the national average rate


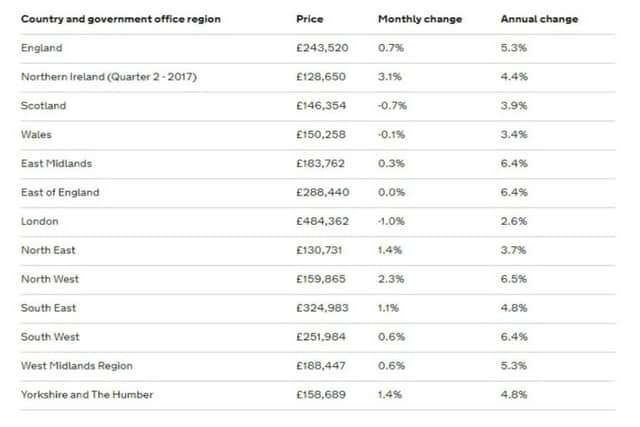
England once again saw the biggest price increase compared to the rest of the UK, with house prices increasing by 5.3% over the year to August, reaching £243,500 on average.
Peterborough however saw an increase of 11% to £186,105 on average.
Advertisement
Hide AdAdvertisement
Hide AdThe area showing the largest annual growth was Wellingborough in Northamptonshire, where house prices swelled by 15.3% to reach £215,000 on average.
The lowest annual growth was recorded in the City of London, where average prices fell by 5.6% (but still stand at £801,000).
Average prices/annual change:
England: £243,520 / 5.3%
Scotland: £146,354 / 3.9%
Wales: £150,258 / 3.4%
Northern Ireland: £128,650 / 3.1%
House prices by city:
Aberdeen: £167,903 / -4.8%
Bristol: £277,243 / 5.9%
Birmingham: £175,943 / 7.0%
Bradford: £138,890 / 4.6%
Brighton and Hove: £365,601 / 5.1%
Cardiff: £196,625 / 2.5%
Coventry: £178,268 / 8.6%
Dundee: £125,847 / 5.7%
Edinburgh: £246,611 / 10.4%
Glasgow: £125,634 / 5.7%
Hull: £110,427 / 7.2%
Leeds: £176,015 / 4.1%
Leicester: £161,616 / 8.2%
Liverpool: £126,862 / 5.5%
London: £800,802 / -5.6%
Manchester: £166,982 / 8.6%
Newcastle upon Tyne: £162,876 / 2.8%
Peterborough: £186,105 / 11.0%
Plymouth: £171,921 / 3.4%
Portsmouth: £200,551 / 5.5%
Preston: £126,332 / 0.0%
Salford: £157,365 / 11.1%
Sheffield: £158,343 / 4.3%
Sunderland: £117,212 / 3.0%
Wakefield: £144,016 / 5.0%
York: £246,957 / 4.5%
The UK House Price Index (UK HPI) is calculated by the Office for National Statistics and Land & Property Services Northern Ireland.